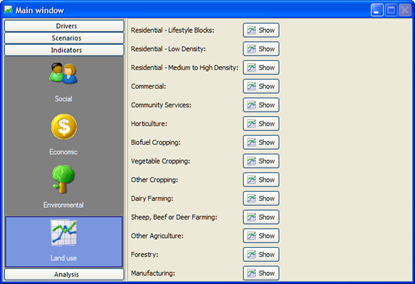
3 Policy interface
The user interface of the WISE system provides access for two types of users: the policy user who carries out impact assessment studies related to the impact of certain policies under a range of external conditions and the modeller, who is responsible for the underlying (scientific) information of the system and needs to adapt underlying data and parameters when more data or information becomes available over time.
The Main window of WISE provides access for both types of users. The structure of the Main window is available in the section Main Window. Here we will first explain how the policy user can use the system and then how the modeller can access the models.
The policy user finds access to all information relevant for analysing the impact of policies and external factors on the left hand side of the Main window. Information is organised in such a way that the user can carry out a structured analysis. It follows the steps Drivers, Scenarios, Indicators and Analysis, each of which is explained in more detail below.
3.1 Overview of the policy interface
This section gives a brief overview of the steps you can take to carry out a policy impact assessment with WISE. In the following sections each step will be explained in detail.
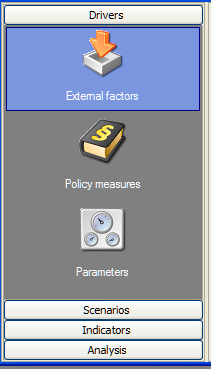
When clicking on the Drivers tab in the navigation pane on the left hand side of the window you get access to the different types of drivers: External factors, Policy measures and Parameters. The first two are part of the policy analysis functionality of the system; the latter is the way scientists or modellers can get more detailed access to the underlying models, their data and their parameters. Clicking on each of the driver type icons opens the settings for this driver or set of drivers in the content pane on the right.
3.1.1 Step 1: Setting up the drivers
Drivers incorporated in the system are organised in two groups: External factors and Policy measures. When you click on one of these, you get access to the underlying information. This is also the entry point for adapting drivers and entering new data.
The result of this step is a set of sub-scenarios for each of the drivers. When developing a sub-scenario you can build on existing sub-scenarios which are part of the active integrated scenario. For example, if the Baseline integrated scenario is selected as the active integrated scenario, for the driver External factors, a Baseline sub-scenario for the external factors - population driver is loaded that includes all the baseline information about the population. If you want to build on this sub-scenario, you simply load the Baseline integrated scenario, make the required changes and save it under a different sub-scenario name for the population driver.
Drivers for policy user that are included in WISE are the following:
External factors:
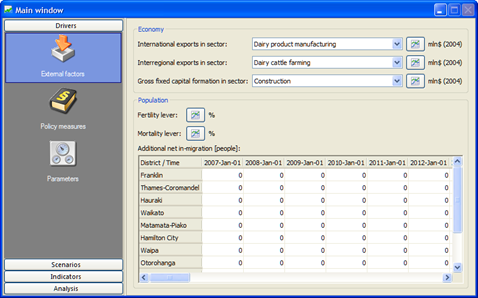
- Economy: international exports, interregional exports, gross fixed capital formation
- Population: fertility lever, mortality lever, additional net in-migration for each district
Policy measures:
- Economy: rates of change in land productivity, rates of change in labour force productivity
- Population: proportion of people living in each residential land use category for each district
- Zoning measures
- Infrastructure
Steps required to view or change driver settings are described in the section Setting up the drivers. 3.1.2 Step 2: Creating integrated scenarios In the second step, integrated scenarios can be assembled from a selection of existing sub-scenarios. For each of the drivers you need to select one sub-scenario.
When clicking on the Scenario manager icon in the navigation pane of the main window you gain access to that part of the interface where you can construct your integrated scenarios or upload an existing integrated scenario. Steps required to create integrated scenarios are described in the section Creating integrated scenarios.
3.1.3 Step 3: Running the simulation
Obviously you cannot investigate all land use changes, as well as other available information, while the system is running. Therefore you have several possibilities to export intermediate and final results of the simulation:
- You can select an individual map and export it to analyse it.
- You can create logged maps using log maps function which could be analysed afterwards in the Map Comparison Kit (part of the WISE package) or common GIS packages.
- You can make an animation that shows you the land use, indicators or other model results change over time. You can open the animation in a viewer, but can also incorporate them in presentations.
- You can create a link to Excel through which all selected model block results are directly written to Excel. This can be used for analyses and post-processing afterwards.
Before running the simulation you can decide which results you would like to save to disk. For details about running the simulation and saving results, please refer to the section Running a scenario and the section Saving results.
3.1.4 Step 4: Visualising indicators
After simulation is finished, WISE offers several options to analyse results. The first option is to visualise indicators that are being calculated by the system. The indicators are organised in four groups:
- Social indicators
- Economic indicators
- Environmental indicators
- Land use indicators
On a yearly basis each of these indicators is calculated. Depending on the type of indicator, it is calculated at one of the spatial levels (NZ & world, regional, district and local) or at several spatial levels. You gain access to the indicators by clicking the Indicators icon in the main window. Steps to take in visualising indicators are described in the section Visualising indicators.
3.1.5 Step 5: Analysing results
The final step of the impact assessment study is to analyse results within an integrated scenario (e.g. the temporal evolution of an integrated scenario) or to compare a set of integrated scenarios. In step 3 of the assessment you have selected what type of information you want to save for analysis. In this step you carry out the analysis thereof. The Excel files that have been created can be analysed with Excel; the animations can be shown in a viewer; and the logged maps that have been saved in log-files that can be opened in the Map Comparison Kit, which can be opened when going to the Analysis tab of the Main Window.
3.2 Setting up the drivers
In this section you will become familiar with the different drivers in the system and learn how to enter and change information related to these drivers. There are 3 sections under the Drivers tab: External factors, Policy measures and Parameters. Among them, the Parameters section is relevant only to a modeller. A detailed description of the Parameters section is found in the section Modeller interface.
When you start the system with the project file Waikato.geoproj, all baseline data is loaded into the system. In the following sections you will learn how to view and change the baseline information for each of the drivers in the system. Creating new sub-scenarios for the individual drivers can be done in two ways:
- By building on the baseline information. In this case adaptations are being made to the data that comes up when you open Waikato.geoproj.
- By building on information in other sub-scenarios. In this case you first have to load a sub-scenario for a specific driver and subsequently make your adaptations.
Both options will be shown in the following sections.
3.2.1 External factors
For true integration amongst different disciplines, WISE incorporates not only economics modelling, but also models related to climate change, hydrology, water quality, demography, land use and terrestrial biodiversity. In the economic model, some parameters are external factors and some are policy measures.
When you click the External factors icon in the navigation pane on the left hand side of the Main window, you will see the following external factors on the right hand side of this window:
- Economy
- Population
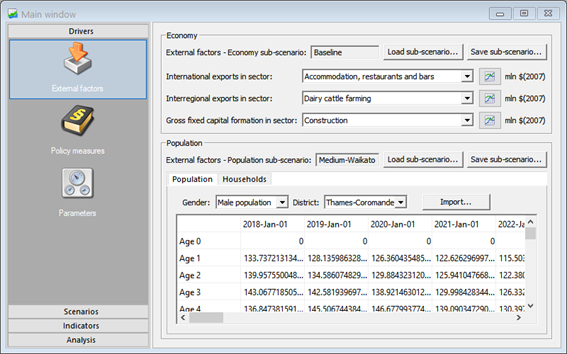
For each you can save their respective current settings as sub-scenarios, or load existing sub-scenarios.
3.2.1.1 Working with sub-scenarios - creating a new sub-scenario
Working with sub-scenarios is the same across all external factors. Here we will use ‘Economy’ as the example.
- Select the Baseline integrated scenario as the active integrated scenario from the dropdown list on the toolbar.
- Go to the Driver tab of the Main window.
- Click the External factors icon.
- Go to the Economy part in the content pane.
- Click the graph icon of your interest. For instance, click the graph icon next to ‘International exports in sector’. The graph window opens.
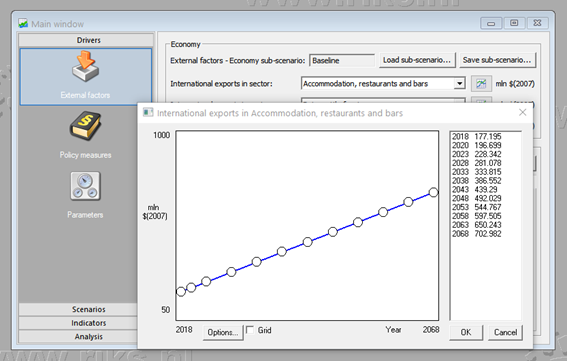
There are several ways to enter new data values into the system. The first way is to drag the bubbles in the graph to the desired value. You can also enter the precise values by clicking on a bubble with your right mouse button or by clicking on a value in the list on the right hand side of the window. More bullets can be added by double clicking with the mouse in the graph and bubbles can be removed by double clicking with the left mouse button on a bubble.
- Remove all points (bubbles) for which you do not want to provide scenario information.
- Add a point for years you would like to provide scenario information for.
- Drag the bubble(s) of the year(s) you would like to change to the desired location.
- Or right-click the bubble to enter the exact values for the year.
- Press the OK button to save your results and close the graph.
You have now adapted the economics scenario in the external factors section. After you have created a new sub-scenario for a driver you can save this sub-scenario. * Go to the File menu. * Click Save project. The Save project dialog window opens.
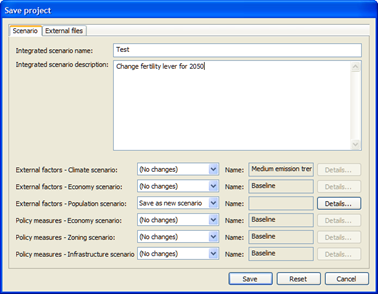
The system now allows you to choose between updating the non-predefined present integrated scenario and creating an integrated scenario under a new name. Note that you are not able to update sub-scenarios that are part of the predefined integrated scenarios. In this case the system will automatically inform you that you can only save the sub-scenario under a new name.
To create a new integrated scenario,
- Enter the new integrated scenario name in the text box next to Scenario name.
- Enter the description for this integrated scenario in the text box next to Scenario description.
To save the sub-scenario you have just created under a new name.
- Select Save as new scenario on the dropdown list for the Economy scenario row.
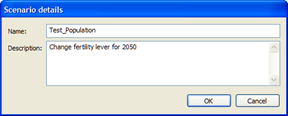
- Click the Details… button. The Scenario details window opens.
- Enter a new sub-scenario name and add a short description of the sub scenario.
- Click the OK button.
- Click the Save button at the bottom of the Save project dialog window.
You have now created a new sub-scenario Test_population for the external factors - economy scenario and a new integrated scenario Test. This sub-scenario can be used in the next step of the policy impact assessment: Creating integrated scenarios.
3.2.1.2 Working with sub-scenarios - loading an existing sub-scenario
To load an existing sub-scenario, you should know how to work with the scenario manager. For more information, see the section Creating integrated scenarios.
- Go to the Scenarios tab of the Main window.
- Click the Scenario manager icon in the navigation pane.
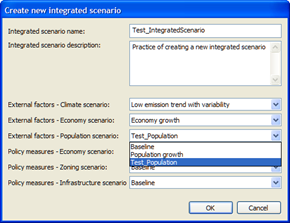
- Click on the New… button on the top-right of the content pane. The Create new integrated scenario dialog window opens.
- Give your integrated scenario a new name and give a description of the integrated scenario (something you can remember the scenario by).
- Click on the dropdown list next to External factors - Economy scenario. The existing external factors - economy sub-scenarios display on the list. Select the one that you want to load.
- Select the sub-scenarios for other drivers and press the OK button of the Create new integrated scenario dialog window.
- Select the newly added integrated scenario on the dropdown list next to Integrated scenario on the toolbar.
- Go to the Driver tab of the Main window.
- Click the External factors icon.
- Go to the Economy part in the content pane.
Now you have loaded the external factors - population sub-scenario that you had selected for the newly added integrated scenario. When you know the existing external factors - economy sub-scenario that you are interested in is incorporated in a certain integrated scenario, you can load this integrated scenario.
- Select the integrated scenario which incorporates your external factors - economy sub-scenario of interesting on the dropdown list next to Integrated scenario on the toolbar.
- Go to the Driver tab of the Main window.
- Click the External factors icon.
- Go to the Economy part in the content pane.
3.2.1.3 Importing population data
Instead of having to enter new population data value-by-value, WISE provides you with a way of reading these values from an Excel sheet. To do so, click the ‘Import’ button in the ‘Population’ tab. WISE assumes the data in this Excel sheet is in a very specific format – with the years in columns and the rows for each combination of age cohort and gender. More specifically:
- The region name should in column B
- All data should be provided in order of region. This order should be the same as all other places where data in WISE is provided by region, i.e. the same order as that of the legend of the region map. The names in the Excel sheet do not have to match the exact names in the region map legend.
- Sex should be in column C, as strings that say either ‘Male’ or ‘Female’.
- Age cohort should be in column D. When it says 'B' (‘birth’), that row will be discarded.
- Number of people for each year are in columns E:BC for years 2018:2068 respectively.
- There can be no empty rows.
- Empty cells where there is a value in the 'region' row and a value in the 'time' column are interpreted as 0.
- The first row has years, starting in column E (which should be the start year of the simulation), up to the number of years in the simulation (i.e., one value per year).
3.2.2 Policy measures
Besides external factors, WISE also incorporates measures for economy, population, zoning regulations and infrastructure. These measures can be found by clicking on the Policy Measures icon under the Drivers tab in the navigation pane on the left hand side of the Main window. On the top part of the window you can enter and display the economic information, the middle part the population and zoning information, and the bottom part is reserved for infrastructure network. First, you will learn how to adapt the economic and population measures. Second, you will learn how to work with the Zoning Tool. Finally, the options related to the Infrastructure will be explained.
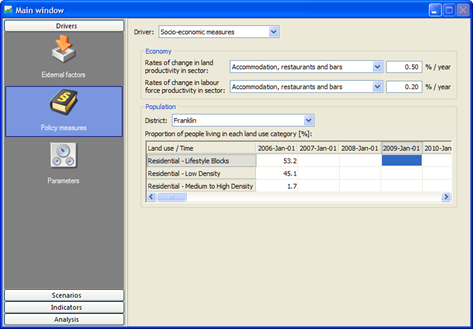
You can find the Economy part on the top right of the Policy measures window. Here you can adapt the values of Rate of change in land use productivity and Rate of change in labour force productivity for each sector.
3.2.2.1 How to adapt values of economy measures?
- Go to the Driver tab of the Main window and click the Policy measures icon in the navigation pane.
- Select the Socio-economic measures from the dropdown list next to Driver.
- Go to the Economy part in the content pane.
- Select the economic sector of your interest from the dropdown list next to Rates of change in land productivity in sector.
- Enter a new value in the text box on the right side for Rates of change in land productivity in sector.
You have now changed the value of the rates of change coefficient for a certain sector.
3.2.2.2 How to adapt values of population measures?
- Go to the Driver tab of the Main window and click the Policy measures icon in the navigation pane.
- Select the Socio-economic measures from the dropdown list next to Driver.
- Go to the Population part in the content pane.
- Select the district of your interest from the dropdown list next to District.
The values of proportion of people living in each residential land use category for the selected districted are displayed in the table. The sum of proportion of people living for each land use category should be exactly 100. Otherwise, the values in that column are highlighted in red background.
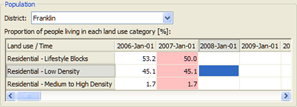
The values for the start year of the simulation are given by default. If the columns are displayed as empty, that means the values for the start year will be used constantly over the simulation period. If the values are specified for more than one year, the system takes the interpolated values for the unspecified years on the basis of the values for its two closest specified years.
- Specify the values for a specific year by entering new values for each residential land use category. The sum of proportion of people living for each land use category for this year should be exactly 100.
You have now changed the policy measure for population for a certain district.
Besides socio-economic policy measures, WISE also incorporates measures for zoning regulations and transport. You can select one of them on the dropdown list next to Driver in the content pane.
First, you are going to learn how to incorporate the spatial planning with a tool named Zoning tool. Next, the options related to the Infrastructure will be explained.
3.2.2.3 Zoning maps
Zoning maps represent the policy part of the land use allocation process. Different locations have different restrictions for particular land uses. Areas that can be facilitating for one land use can be restrictive for other land use functions like protected nature, which facilitates natural land uses and at the same time restricts developments in residential or industry & commerce land uses. For this reason there is a specific zoning map for each main land use function incorporated in the system: residential (lifestyle blocks, low density and medium to high density), commercial, community services, horticulture, biofuel cropping, vegetable cropping, other cropping, dairy farming, sheep, beef or deer farming, other agriculture, forestry and manufacturing. The vacant land uses do not have a specific zoning map since we assume that this type of land use is allowed everywhere, but that there are no areas where it is specifically planned. In general, vacant land uses are the land uses that appear when (agricultural) land is abandoned and also the land use that can easily be taken over when population or economic functions expand.
3.2.2.4 Zoning tool
In WISE, the Zoning tool developed by RIKS is incorporated in the system that allows you to incorporate your spatial planning to the system by creating and edit zoning maps based on a number of spatial plans. With the Zoning tool, you can enter spatial zoning plans directly via the graphical user interface (GUI) and set the characteristics of each plan (parameters) and add new plans in the GUI as well in a comprehensible way. Plans can be ordered hierarchically, such that one overrules the other. When more information on zoning plans becomes available, this can be incorporated in the zoning maps, either by the project team, or by the users themselves.
Before you start working on creating or editing the zoning maps with the zoning tool, you should understand the meaning of terms which are used in the Zoning tool.
Plan – A plan is a map that represents any spatial plan. It contains source data which is not interpreted yet. The data in a plan should be categorical, not numerical. The map that represents the plan should have the same geo-reference as the region map (lower-left x coordinate, lower-left y coordinate, cell size, number of rows and columns). The data itself need not cover the entire modelling area, for example because it only covers one municipality. Uncovered areas must have a ‘no data’ value.
Category – A spatial plan can have one or several categories, each of which is represented by a category in the map. For example, a plan that outlines the protected areas can have the categories protected forests, protected natural area and non-protected nature. No data values in the map will be interpreted as no data in the zoning tool – that is, they cannot be assigned a zoning status other than no data.
Zoning status – Each category in a plan needs to be interpreted in terms of their zoning status for each land use function separately. Moreover, a category can be interpreted as no data, meaning that the specific category does not influence a specific land use function or that no information for that location is available.
Start time / End time – A category in a plan can start and stop at any given time in the simulation.
Zoning map – The zoning map is the result of the interpretation and combination of all categories in all spatial plans. It indicates the zoning status in each cell for a particular time span. Zoning maps are specific for each land use function and have a timestamp, since zoning regulations can change over time.
Numerical zoning map – The numerical zoning maps are used to calculate the total potential maps. They are derived from the (categorical) zoning maps for the current simulation time and the current land use map. Strictly, numerical zoning maps do not exist in the zoning tool itself, since the conversion to numerical values takes place when computing the total potential. For more information, see the section Zoning.
The following paragraphs describe the features of working in the zoning tool.
- Each category in a spatial plan is interpreted for all land use functions separately. In WISE, A category can be given one of the following interpretations/zoning status: Permitted, Controlled, Restricted discretionary, Discretionary, Non-complying, Prohibited and Unspecified. Refer to the Specification Report for more information about the zoning status used in WISE.
- Some plans can overrule others; hence the order of the plans represents a hierarchy. This can mean that restrictions in one plan become allowed in the final zoning map, because they are overruled. This hierarchy can be set at the level of the categories (per plan). For example, an order could consist of Plan A, category 1; Plan B category 1, Plan A category 3, Plan C category 1, etc. This hierarchy among categories is assumed to be the same for all land use functions.
- A category in a plan can start or stop at any given point during the simulation. By default a plan is valid from the start year of the simulation until the end year of the simulation. However the start year, the end year or both can be set per category. This time setting per category is assumed to be equal for all land use functions.
- The result of the combination of the categories of all plans is a categorical map (the zoning map) that shows the zoning status for each cell. However, since plans can start and stop at any given time in the simulation, there is a separate zoning map for each point in time when a new plan starts or ends.
- Since some plans only start after the initial year of the simulation, each year the zoning status is corrected for the De Facto land use. Hence, if a location has a certain land use, it will not be removed because of newly introduced zoning plans. To disable this option, uncheck all the check box in the De Facto zoning table through the modeller user interface. For more information, see the section Zoning.
3.2.2.5 General steps to create zoning maps in the zoning tool
You can take the following steps in general to introduce a new spatial plan and create the zoning maps.
- Go to the Zoning tool via Main window → Drivers → Policy measures → Driver Zoning.
- Import the maps representing the spatial plans into the system.
- Set the hierarchy among categories by clicking on the category and clicking the scroll buttons on the left side of the table to move them upwards or downwards through the hierarchy. This hierarchy is assumed to be the same for all land use functions, and therefore it only needs to be set once.
- Set for each category the start year and the end year when this is different from the default value. This start year and end year per category is assumed to be similar for all land use functions and therefore needs to be set only once.
- For each land use function interpret all categories. This can be done by selecting the proper interpretation from the available options.
- Set the matrix of De Facto land uses that is used to compute the numerical zoning maps through the modeller user interface. For more information, see the section Zoning.
In the following steps you will learn in detail how to set up the zoning regulations for a new project and import a new plan to the existing overlay via the GUI of the zoning tool.
3.2.2.6 How to set up spatial planning for a project file with an empty zoning tool?
For example, a WISE project file has been set up without information on spatial planning. You would like to introduce a district reserves and covenants map and a protected areas map and you know how to interpret the values in these maps.
- Make sure that you have opened the new project file to which you want to introduce these maps.
To access the zoning tool:
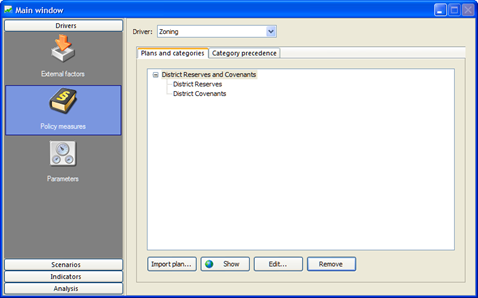
- Go to the Drivers tab of the Main window and click the Policy measures icon.
- Select Zoning in the dropdown list next to Driver in the content pane on the right side of the Main window. It is empty in the content pane except for some buttons at the bottom.
To import a new plan:
- Make sure that the plans you want to introduce are pre-processed to the correct raster format for inclusion in WISE. They should have the same size, resolution, projection, lower-left coordinate as the regions map used in the system and with the file extension .asc, .img or .rst.
- Click the Import plan… button at the bottom of the content pane. The Import plan dialog window opens.
- Enter a name for the spatial plan District Reserves and Covenants that you are going to import in the text box next to Name. Click the browse button next to Map file. The Select zoning plan map window opens.
- Navigate to the spatial plan file that you want to import and double-click on it.
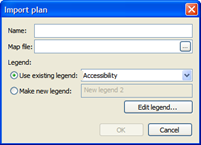
To use an existing legend for the newly imported plan: If the legend for the spatial plan that you just imported already exists in the system, you can use this existing legend:
- Click on the radio button in front of Use existing legend.
- Select the legend from the dropdown list next to Use existing legend.
- Press the OK button in the Import plan dialog window.
To create a new legend for the newly imported plan: If there is no legend file for the spatial plan that you just imported, you can create a new legend for it.
- Click on the radio button in front of Make new legend.
- Enter the legend file name for in the text box next to Make new legend.
- Click the Edit legend… button. The Legend editor dialog window opens.
- Edit the legend for the spatial plan that you just imported in the Legend editor dialog window. For more information, see section Legend editor.
It is important to define the categories with correct number of classes and proper labels in the Legend editor dialog window when you import a new plan.
- Press the OK button in the Legend editor dialog window and close the Legend editor dialog window.
- Press the OK button in the Import plan dialog window.
Now you have imported the spatial plan and selected or created a legend file for it.
To modify the legend for a newly imported plan:
- Select the spatial plan on the Plans and categories tab.
- Click on the Edit… button. The Edit zoning plan dialog window opens.
- Click the Edit legend… button.
- In the Legend editor dialog window, you can enter new labels and set new colours. For more information, see section Legend editor
- Press the OK button in the Legend editor dialog window and close the Legend editor dialog window.
- Press the OK button in the Edit zoning plan dialog window.
The categories of this plan will be updated automatically. If you want to modify the legend of a spatial plan, it is important for you to access the Legend editor dialog window via the Edit… button instead of the Show button on the Plans and categories tab.
It should be noted that except for editing colours, changing other parts of the legend will cause the reset of the zoning tool. In other words, the setting you made on the Category precedence tab will be initialized. Therefore, it is recommended to first edit the legend (including defining the labels) for the imported plan before setting the parameters on the Category precedence tab.
To show a plan and its categories
- Go to the Plans and categories tab.
- Double-click the plan Protected areas that you just imported.
The content pane under the Plans and categories tab now fills with a hierarchy three that shows an item District Reserves and Covenants with the two sub-items categories: District Reserves, and District Covenants.
You can expand or collapse the braches of plan and categories tree by moving the mouse over the name of plan and double-click or moving the mouse over the box in front of the name and left-click.
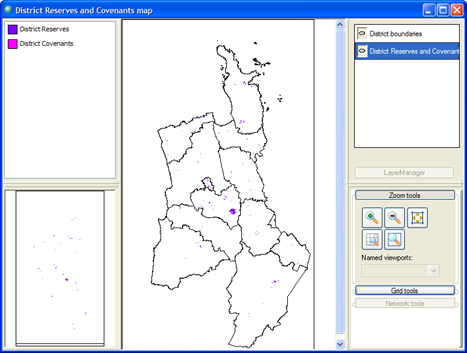
To check that you selected the right map,
- Select the District Reserves and Covenants item under the Plans and categories tab.
- Click the Show… button under the plans and categories tree. A map window opens showing you the District Reserves and Covenants map window.
- Close the District Reserves and Covenants map window.
You can import a second plan similarly:
- Click the Import plan… button. The Import plan dialog window opens.
- Enter a name for the Protected Areas map click the browse button next to Map file to select the map file for Protected Areas.
- Create a new legend for the Protected Areas map.
- Click the OK button in the Import plan dialog window.
The Protected Areas hierarchy tree is added in the content pane which shows the item Protected Areas with its six categories.
By default, the zoning status of each category is set to unspecified. According to your interpretation of each category, you can set the Zoning tool by the following steps:
- Go to the Categories precedence tab.
- Set the hierarchy among categories by selecting the category and clicking the scroll buttons to move them upwards to downwards through the hierarchy. A category that is higher on the list will overrule categories that are lower on the list in case they are in conflict.
We assume that the hierarchy is a function of the plan itself, and not for the specific land use type in WISE. Therefore you don’t need to set up the hierarchy for each land use type as it is the same for all land use functions.
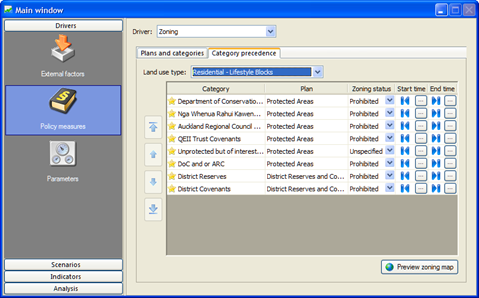
- Select Residential – Lifestyle Blocks from the dropdown list next to Land use type.
- Set the zoning status for each category on the list by selecting the one from the drop down list in the Zoning status column.
Finally, you need to set the start and end time of each category. By default these are set to begin and end of the simulation, which is fine for the most categories. For example, the restriction to develop Residential – Lifestyle Blocks according to the District Reserves only starts from 2010.
-
Click the browse button in the Start time column and the District Reserves raw. The Start date for category dialog window opens.
-
Click the radio button in front of the Specific date and click the 1-1-2010 from the dropdown list. Then press the OK button.
The specific start time appears in the corresponding cell of the table. For the categories for which you have not specified the start time or the end time, the symbol is displayed in the start time column and the symbol is displayed in the end time column to indicate the start of simulation and the end of simulation, respectively.
The zoning regulations for the land use function Residential – Life style blocks is set as depicted in the figure above. Now you can preview the zoning map for this land use.
- Make sure you have selected Residential – Life style blocks on the drop down list next to Land use type.
- Click the Preview zoning map button at the bottom of the content pane of the Spatial planning window. The Preview zoning map Residential – Lifestyle Blocks window opens.
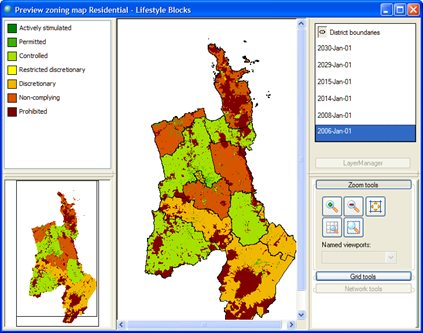
In the map window, multiple layers of the zoning map for Residential – Lifestyle Blocks at different time points are available in the layer manager pane. The map displayed in the Map pane represents the zoning map for the selected time point. The reason for displaying these layers is that these time points are used to set as either the start time or the end time for different categories for the selected land use. For more information about working with a map window, see the section Map window.
3.2.2.7 How to change a plan in the list?
- Make sure that you have opened the Zoning tool.
- Go to the Plans and categories tab in the content pane.
- Select the plan that you want to edit on the plan and categories tree by clicking on it.
- Click the Edit… button under the plan and categories tree. The Edit zoning plan dialog window opens where you can change the name of the plan in the text box next to Name, you can load a new plan and load a new legend file or edit the legend of the plan.
- Click the OK button in the Edit zoning plan window to save changes that you made.
3.2.2.8 How to remove a plan from the list?
- Make sure that you have opened the Zoning tool in front of you.
- Go to the Plans and categories tab in the content pane.
- Select the plan that you want to remove on the plan and categories tree by clicking on it.
- Click the Remove button under the plan and categories tree.
You have removed the selected plan from the list. The corresponding categories of this plan will be removed as well in the Categories precedence tab.
3.2.2.9 How to introduce a new plan to the set of zoning regulations?
Based on the zoning regulations that you just set up in the previous section (How to set up spatial planning for a project file with an empty zoning tool?), you can now introduce a new plan. This new plan should be pre-processed in a GIS package with the correct raster format to be used by WISE.
- Make sure that you have opened the Zoning tool in front of you.
- Click the Import plan… button. The Import plan dialog window opens.
- Enter the name of the new plan, and load the map and its legend on your computer. Click the OK button in the Import plan dialog window.
The new plan hierarchy tree is added in the content pane with the sub-items as categories.
- Click the Categories precedence tab. The categories in the new plan show up lowest in the hierarchy. By default new plans are valid for the whole simulation period and the zoning status is set to ‘unspecified’.
Now you need to adjust settings for the categories in the new plan on the basis of the existing hierarchy that already includes protected areas and district reserves and covenants. According to your interpretation of each category, you can interpret the new zoning regulation as follows:
- Go to the Categories precedence tab.
- Set the hierarchy among categories in the new plan by selecting the category and clicking the scroll buttons to move them upwards to downwards through the hierarchy. From the top to the bottom, the one on the top overrules the one on the above.
- Drag the category No data to the bottom of the hierarchy.
- Set the hierarchy among categories in the new plan by selecting the category and clicking the scroll buttons to move them upwards to downwards through the hierarchy.
You have adjusted the hierarchy for all the categories in the three plans now. You don’t need to adjust the hierarchy for each land use type because this is the same for all land use functions.
- Select Residential – Lifestyle Blocks from the drop down list next to Land use type.
- Set the zoning status for each category in the new plan by selecting one from the drop down list in the Zoning status column.
You need to set the zoning status for each category, and specify the start and end time of each category. The final zoning regulations for the land use function Residential – Lifestyle Blocks is set on the basis of three plans. Now you can view the zoning map for industry that you just set up.
- Make sure you have selected Residential – Lifestyle Blocks on the dropdown list next to Land use type.
- Click the Preview zoning map button at the bottom of the content pane of the Zoning window. The Preview zoning map Residential – Lifestyle Blocks window opens.
The set of zoning maps is recomputed when the simulation is opened and every time a change is made in the settings of the Zoning tool. The zoning map displayed in the Preview zoning map window will be updated automatically if a change is made in the setting of the Zoning tool.
3.2.2.10 Infrastructure networks
The relationship between land use and transport systems is generally recognized, by planning professionals as well as scientists. Also, and importantly, it is recognized that the relationship is reciprocal, which means that developments in land use are in part a consequence of the transport system and, at the same time, developments in the transport system are by large the effect of land use changes.
The current version of WISE only incorporates a one-way interaction from transport on land use. In future versions a transport model can be incorporated with which the impact of land use on transport can also be calculated. In WISE infrastructure is represented as network layers. There are three network layers incorporated in WISE: Transport network (road and railway), Major processing sites and Residential attractants.
Accessibility is a function of the distance of a location to this network and its importance, which can be set from the modeller user interface. Policy decisions related to the changing accessibility are mainly the construction of roads, railways and (possibly) irrigation networks. In this exercise you will learn how to adapt the road network.
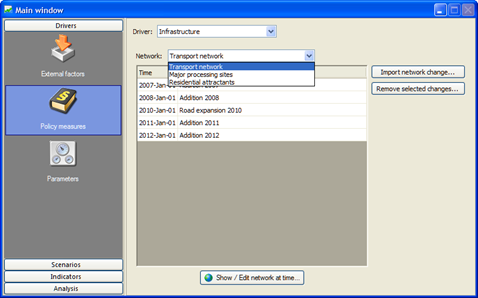
The figure above shows the policy user interface for the Infrastructure driver. The changes to the network are listed in the table with time and descriptive names. It is allowed to have several changes in the same year. You can use the button Show / Edit network at time… to open a window with a single network map displaying the network at the chosen time (incorporating all specified network changes). You can add or remove elements from this network or change the accessibility type of an element (residential road, etc.) by using the Import network change… button or the Remove selected changes… button. You can store the changes you made as a new network change and give a descriptive name. You can view and edit each network change in isolation in the modeller user interface via Main window → Drivers → Parameters → Land use → Accessibility → Go to infrastructure layers button → Infrastructure layers window (for more information see the section Accessibility ).
3.2.2.11 How to view an infrastructure network?
- Go to Drivers tab of the Main window.
- Click Policy measures icon in the navigation pane on the left side of the Main window.
- Select Infrastructure from the dropdown list next to Driver.
You will see the information related to infrastructure displayed on the content pane.
To view a network at a specific time:
- Select the infrastructure network of interest from the dropdown list next to Network.
- Click the Show network at time… button at the bottom of the window. The Select time for network dialog window opens.
- Select your date of interest on the dropdown list of the Select time for network window.
- Click the OK button in the Select time for network window. The Network layer ### *** map window opens, where ### represents the name of the selected infrastructure network and *** represents the selected date.
3.2.2.12 Network map window opened via the policy user interface
The user interface of the network map window opened via the policy user interface is different from the one opened via the modeller user interface. In this section, we focus the one opened via the policy user interface. For the latter one, please refer to the section Network map window opened via the modeller user interface.
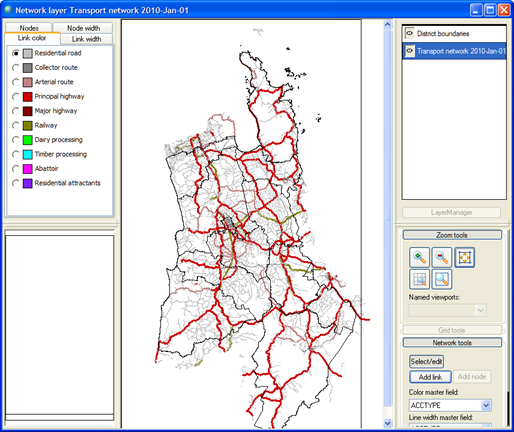
This window with a single network map displays the network at the chosen time (incorporating all specified network changes). The figure above is an example of the transport network for 2010. The title of the network map window indicates the descriptive name of the selected network and the selected year. As depicted in the figure above, besides the District boundaries layer, there is only one layer Transport network 2010-Jan-01 visible in the layer manager pane, which shows the high-level overview of the network changes for the selected time in the map pane.
The legend pane consists of 4 legend tabs which are used for editing the legend of network map. The Link color tab and Link width tab are the most useful tabs. For more information about how to edit legend, see the section Legend editor.
- In WISE, for all infrastructure layers, the categories of Acctype are used as the legend. For more information, see the section Network legends.
The ratio buttons in the legend pane indicate that this network map is editable. You can view and edit the link properties or add new links on the network map.
For all the Infrastructure layers in WISE, you can view or edit the accessibility type.
- Select the network layer of interest from the dropdown list next to the Network, for example, the Transport network.
- Double-click on the link of interest on the selected network layer. The Edit accessibility type dialog window opens. This is the link property used in the land use model. You can edit the accessibility type for the selected link from here.
- Click Cancel to close the Edit accessibility type dialog window.
-
Or click OK to confirm the change that you made. A message window appears to ask you whether or not to save the changes you have made.
-
Specify the name and path of the file that you want to save changes to.
- Press OK.
3.2.2.13 How to import a network at a specific time?
You are going to import a network change for the year 2010 that only indicates the information of the new roads which will be built in the year 2010. The network change map is prepared in a GIS package with the correct format required in WISE.
- Go to Drivers tab of the Main window.
- Click Policy measures icon in the navigation pane on the left side of the Main window.
- Select Infrastructure from the dropdown list next to Driver.
- Select Transport network on the dropdown list next to Network.
- Click the Import network change… button on the right side of the content pane. The Import network change dialog window opens.
- Enter a name that could describe this network change in the text box next to Name.
- Click the browse button next to File. The Open network change layer dialog window opens.
- Select the network change map for the year 2010 and double click it. This map file should have the extension *.shp.
- Select 2010-Jan-01 on the dropdown list next to Time.
- Click the checkbox next to Incremental.
-
Press the Ok button in the Import network change dialog window to save changes that you made.
-
If the network change map that you are importing only indicates some new changes for the chosen time, you should select the option of Incremental by clicking the checkbox next to Incremental.
- If the network change map that you are importing indicates the whole network map including new changes and non-changed parts for the chosen time, you should not select the option of Incremental.
Now you see the network change for the year 2010 is added on the list.
To verify the network change map that you just imported
- Click the Show / Edit network at time… button on the bottom-right of the content pane. The Select time for network dialog window opens.
- Select the date 2010-Jan-01 on the dropdown list next to Time.
- Click the OK button in the Select time for network dialog window. The Network layer ### *** map window for the selected time opens, where ### represents the selected network layer and *** represents the chose time.
- Unselect the check box next to Show nodes in the Network tools to display all links on the map.
For more information about how to work with the map window, see the section Map window.
3.2.2.14 How to adapt a network at a specific time?
There are two ways to introduce a new road; you can either do it by drawing a line in the user interface of WISE, or by introducing it as a shape file that you prepared in a GIS package. Since the manually drawn segments are often inaccurate and not connected to the rest of the road network, it is advisable to introduce the new road in a GIS first. For the sake of the exercise however, we explain how to draw and remove a road in WISE.
To add a new road
- Go to Drivers tab of the Main window.
- Click Policy measures icon in the navigation pane on the left side of the Main window.
- Select Infrastructure from the dropdown list next to Driver.
- Select Transport network on the dropdown list next to Network.
- Click the Show / Edit network at time… button at the bottom of the window. The Select time for network dialog window opens.
- Select 2010-Jan-1 on the dropdown list of the Select time for network window.
- Click the OK button in the Select time for network window. The Network layer Transport network map window for the selected year opens.
- Zoom in your area of interest with the zoom tools. See the section Zoom tools.
- Select the radio button in front of the network category of interest in the legend pane.
- Click the Select/edit button under Network tools.
- Click the Add link button under Network tools.
- Move the mouse pointer to the location where you want to add the new road and drag it to draw the road. The new road is displayed in the colour defined in the legend pane.
- Click the Select/edit button again to disable the Add link button.
- Double click on the road you just draw or right-click on it and select the option Properties. The Edit accessibility type dialog window opens.
- Verify or select the accessibility type from the dropdown list.
To save the changes
-
Close the map window. A message window pops up to ask you whether or not save the changes you made.
-
Click the Yes button in the message window. The Save network change dialog window opens.
- Enter a name to describe the changes that you made in the text box next to Name.
- Click on the browse button next to File. The Save network change layer dialog window opens.
- Navigate to the folder that you want to save the file and give a new name for this file with extension .shp.
- Click the Save button in the Save network change layer dialog window.
- Click OK in the Save network change dialog window.
The newly added change for 2010 is displayed in the Network change list.
To delete the new link that you just drew
- Click the Show / Edit network at time… button at the bottom of the window.
- Select 2010-Jan-1 on the dropdown list of the Select time for network window.
- Click the OK button in the Select time for network window. The Network layer Transport network map window for the selected year opens.
- Zoom in your area of interest with the zoom tools. See the section Zoom tools.
- Click the Select/edit button.
- Right-click on the newly drawn link and click the Delete on the context menu.
- Repeat the steps above to delete the two nodes of this link as well.
- Close the map window.
A message window opens where you are asked whether you want to save changes you made or not.
- Click the Yes button in the message window. The Save network change dialog window opens.
- Enter a name to describe the changes that you made in the text box next to Name.
- Click on the browse button next to File. The Save network change layer dialog window opens.
- Navigate to the folder that you want to save the file and give a new name for this file with extension .shp.
- Click the Save button in the Save network change layer dialog window.
- Click OK in the Save network change dialog window.
The newly added change for 2010 is displayed in the Network change list.
The text above describes how to save changes that you made on the network map. Be aware that if you use the present name, the existing file will be overwritten with the same name. For more information about how to work with an editable map, see the section Editable map. For more information about how to work with the network map, see the section Network tools
You can also draw a new link or remove a link in the modeller user interface via Main window → Drivers → Parameters → Land use → Accessibility → Go to infrastructure layers button → Infrastructure layers window (for more information see the section Accessibility). It is strongly recommend to add a new link or to remove a link via the policy user interface as described above because the policy user interface doesn’t display all the technical details.
3.2.3 Filtering the economic sectors
In WISE, there are 48 sectors of WRDEEM included in the economic model. These sectors are filtered for display in the external factors, policy measures and economic indicators. A default selection is implemented in WISE. You could adjust the selection which sectors are available for each respective driver or indicator in the economic model window (see the section Sector filter). The filtered lists of sectors are ordered alphabetically for easier look-up.
In this section you have become familiar with the different drivers in the system. In the next section you will learn how to combine these sub-scenarios to create integrated master scenarios.
3.3 Creating integrated scenarios
In the previous sections you have read how to adapt the different drivers that are incorporated in the system. Furthermore, you have learned that each of these drivers can be stored in different sub-scenarios (see the section Saving sub-scenarios). Through this section, the project file Waikato.geoproj will be used as an example.
3.3.1 Predefined scenarios
WISE contains one integrated scenario, the Baseline scenario, which is predefined and is not editable by the user. All sub-scenarios that constitute this integrated scenario are read-only as well.
Particularly, WISE provides 8 predefined sub-scenarios for External factors – Climate driver and you can use them to create new integrated scenarios. The sub-scenario Medium emission trend with variability is read-only since it is used in the Baseline integrated scenario; other sub-scenarios for the climate driver are editable. For more information of these climate scenarios, we refer to the specification report of WISE.
3.3.2 Scenario manager
The Main window in WISE is structured according to the four steps involved in an impact assessment analysis:
- Set up relevant drivers.
- Combine and run scenarios.
- View indicators visually.
- Analyse scenario results visually and analytically.
Each step corresponds with a tab in the main window. The scenario manager is involved in the first two steps.
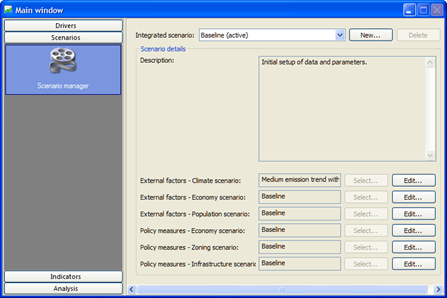
You can access the Scenario manager by clicking on the Scenarios tab of the Main window. The Scenario manager icon is selected automatically in the navigation pane on the left side of the Main window. The content pane on the right side of the Main window shows the content of the scenario manager.
The Scenario manager allows you to change the description of non-read-only integrated scenarios, create new integrated scenarios and delete non-read-only integrated or non-read-only sub-scenarios.
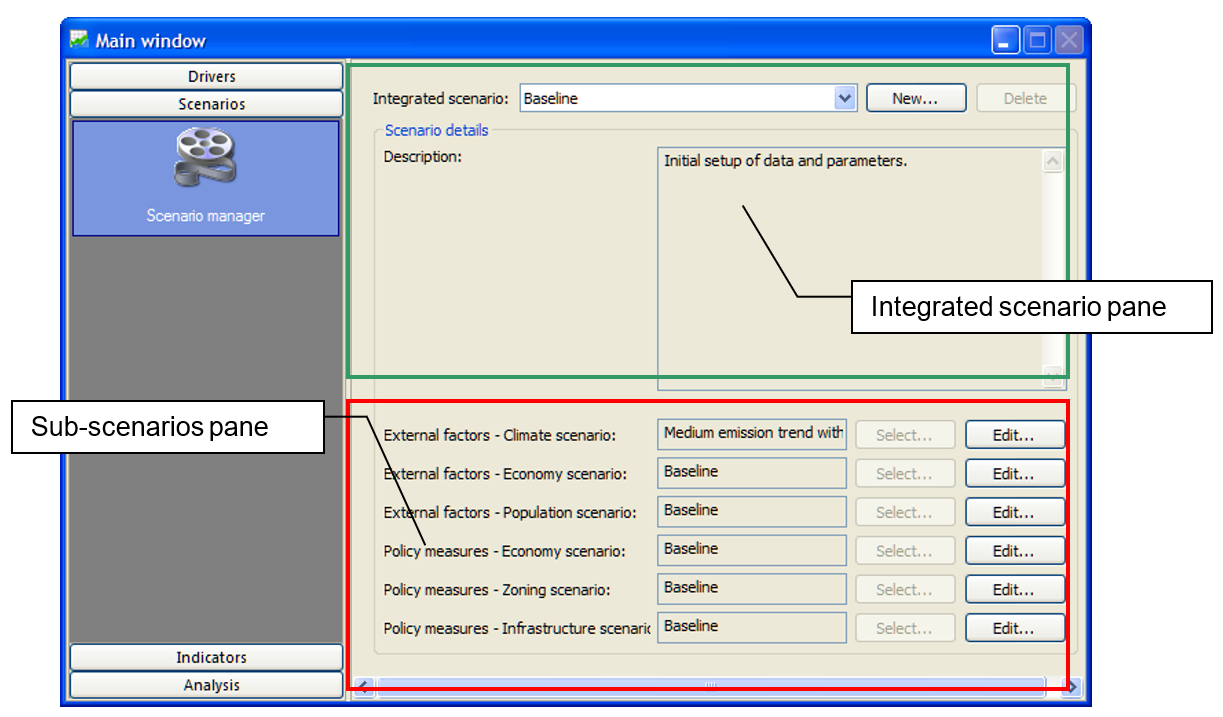
The Integrated scenario pane is in the top part and the Sub-scenario pane is in the lower part of the content pane of the Main window. Note that the term sub-scenario is not used in the user interface. For more information, see the section Project file, integrated scenario and sub-scenario.
-
On the top of the Integrated scenario pane, you can select an integrated scenario from a dropdown list. The active integrated scenario is indicated in the list marked with the word active.
-
When you select an integrated scenario from the list, the description of the selected integrated scenario is shown in the Integrated scenario pane and the selected integrated scenario details in the Sub-scenarios pane will be updated. If you hover the mouse pointer over one of the sub-scenario names, its description is displayed in a tooltip box – the pop-up box with a yellow background.
-
You can edit the description of the integrated scenario directly, unless the integrated scenario is read-only.
-
When the active integrated scenario or a read-only integrated scenario is selected, the Select… button is disabled. When the non-active and non read-only integrated scenario is selected, you can change a sub-scenario which is part of that integrated scenario by clicking the Select… button for the corresponding driver (e.g. Economic scenario, Population scenario, etc). A dialog window opens as depicted below, where you can select one of the available sub-scenarios.
You can view all the sub-scenarios and you can edit the sub-scenarios which are not read-only by clicking the Edit… button. A dialog window opens as depicted below, where you can edit the name and description of that sub-scenario. Sub-scenarios can only be deleted if they are not selected in any of the available integrated scenarios.
3.3.2.1 How to view an existing integrated scenario?
- Go to the Scenario tab of the Main window.
- Click your integrated scenario of interest on the dropdown list next to Integrated scenario on the top of the right side of the window.
- View the description of the selected integrated scenario in the Integrated scenario pane.
- View the sub-scenario for each driver that is incorporated in the selected integrated scenario in the Sub-scenarios pane.
- Move the mouse over the name of your sub-scenario of interest. Its description displays in a tooltip box with yellow background.
Selecting and viewing an integrated scenario does not automatically mean that its data is loaded into the system. Only the active integrated scenario is loaded into the system.
3.3.2.2 How to load an existing integrated scenario?
- Click the dropdown list next to Integrated Scenario on the toolbar at the top of the Geonamica application window (note this is not the list next to Integrated Scenario at the top of the Integrated scenario pane of the Scenario manager window). All the available integrated scenarios will be displayed on the list.
- Select an integrated scenario from the list as the active integrated scenario.
Now this integrated scenario is loaded by the system. However, if changes are made to the input data/files and parameters in the current active integrated scenario, a message window appears to ask you whether or not to save the changes when you switch to another integrated scenario.
- Click the Cancel button if you wish to cancel the action of loading another integrated scenario.
- Click the No button if you wish to discard changes you made in the active integrated scenario. Then the system loads the new integrated scenario as the active integrated scenario.
- Click the Yes button if you wish to save changes you made in the active integrated scenario. The current integrated scenario is displayed on the dropdown list on the toolbar and the Save project dialog window opens where you can determine how to save changes. For more information, see the section Saving changes. After you save the changes in a new integrated scenario via the Save project dialog window, the newly created integrated scenario becomes the active integrated scenario automatically on the dropdown list on the toolbar.
Note that loading the active integrated scenario means loading the input data/files and parameters defined in this integrated scenario to the graphic user interface. In this case, the models have not been updated to the changes. You can use the Update, Step, Run and Reset command to update the models of the system to the changes.
3.3.2.3 How to create a new integrated scenario?
An integrated scenario is a collection of existing sub-scenarios for each driver. There are two ways to create a new integrated scenario in WISE. We first introduce how to create a new integrated scenario in Scenario manager.
- Go to the Scenario tab of the Main window.
- Click the New… button on the integrated scenario pane on the right side of the Main window. The Create new integrated scenario dialog window opens.
- Name the new integrated scenario in the text box next to Integrated scenario name and give a short description in the text box.
- In the sub-scenario pane, select an existing sub-scenario from the dropdown list for each driver.
The existing sub-scenarios on the list has been created when you saved changes by using Save project or Save project as… command on the File menu.
- Click the OK button in the Create new scenario window.
The new integrated scenario Test that you just created is displayed immediately on the dropdown list on the top of the integrated scenario pane.
We now introduce how to create a new integrated scenario by using the Save project command. You can create a new integrated scenario based on an existing integrated scenario.
- Load your integrated scenario of interest by selecting it from the dropdown list next to Integrated Scenario on the toolbar. See ‘How to load an existing integrated scenario?’.
- Adapt your external factors or policy measures of interest. See the section Setting up the drivers.
- Click the Save project command on the File menu. The Save project dialog window opens.
- Give a new name for the integrated scenario that you adapted and define the sub-scenarios for each driver if necessary. For more information, see the section Saving an integrated scenario.
- Press the Save button on the Save project dialog window.
You have now created a new integrated scenario and it displays as the active integrated scenario on the toolbar.
-
If you would like to learn how to create sub-scenarios for different drivers or if you would like to learn how to see the data that is used in the different drivers, go to the section Setting up the drivers.
-
If you want to carry out a simulation with your new integrated scenario, press the Reset button on the toolbar or click the Reset command on the Simulation menu.
3.3.2.4 How to delete an integrated scenario?
You can only delete any integrated scenario which is not read-only and which is not the active one.
- Go to the Scenario tab of the Main window.
- Click the integrated scenario that you want to delete on the dropdown list next to Integrated scenario on the top of the right side of the window. The Delete button becomes enabled if the selected integrated scenario is not read-only and is not the active one.
- Click the Delete button on the top-right of the window.
The integrated scenario that you deleted disappears from both the dropdown list on the toolbar and the dropdown list on the top of the main window. You have now deleted the integrated scenario.
3.3.2.5 How to delete a sub-scenario for a specific driver?
You can only delete a sub-scenario which is not read-only and which is not part of any existing integrated scenario.
- Go to the Scenario tab of the Main window.
- Click the Edit… button next to the specific driver, e.g. External factors - Population scenario. The Edit external factors - population scenarios dialog window opens.
- Click the dropdown list next to Scenario name of the Edit population scenarios dialog window. All the available sub-scenarios for this driver are displayed on the list.
- Click the sub-scenario you want to delete. The Delete button becomes enabled if the selected sub-scenario is not read-only and is not part of any existing integrated scenario.
- Click the Delete button on the top-right of the Edit external factors - population scenarios dialog window. The sub-scenario that you deleted immediately disappears from the dropdown list of the Edit external factors - population scenarios dialog window. But it has not been completely deleted until you press the OK button.
- Click the OK button on the Edit external factors - population scenarios dialog window.
To verify that it is completely deleted,
- Click the Edit… button next to that specific driver, e.g. External factors - Population scenario. The Edit external factors - population scenarios dialog window opens.
- Click the dropdown list next to Scenario name on the Edit external factors - population scenarios dialog window. The deleted sub-scenario is not displayed on this list any more.
3.3.3 Examples of using the scenario manager
The section above describes the detailed information in the scenario manager. This section provides outlines for best use of the scenario manager in WISE. Several case studies will be explained in a step-by step manner.
3.3.3.1 Creating your own sub-scenarios
When you first open WISE, it only contains the baseline, or business as usual, sub-scenarios and the predefined sub-scenarios for climate. There is exactly one integrated scenario called Baseline, which combines the baseline sub-scenario for each driver. You can develop your own sub-scenarios on the basis of these baselines. Defining a High export sub-scenario
- Go to the Drivers tab in the Main window and click on External factors.
- Select the Paper and paper product manufacturing sector from the list for the International exports.
- Click the graph button to open the graph window showing the time line of international exports for the selected sector – see 0.
- Click the Options button to set the maximum value on the Y-axis to 150.
- Right click on the bubbles in the graph to set the values as shown in 0. These values assume a 1% annual growth from 2011.
- When you are done, click the OK button.
You have now changed the time line for international exports for one of the relevant sectors. If you would like, you can repeat the steps above for other sectors as well.
Graph window for international exports opened from the External factors in the Main window Saving the High export sub-scenario You have now entered a scenario for increased international exports in the system and are ready to save this to disk.
- Click the Save button on the toolbar in order to save your changes as a new sub-scenario.
- Select Save as new scenario for the External factors – Economy scenario.
- Click on the Details button to enter a name and description for the sub-scenario – see 0.
- Click the OK button when you have filled in the name and description.
Scenario details window opened from the Save project window
When you save a project in WISE you cannot save only part of the changes you have made, in the same way that you cannot save half a Word document or send half an e-mail. Therefore, you have to either save or discard the changes you have made for each of the drivers. You can overwrite the currently selected sub-scenario or save in a new sub-scenario – thereby retaining the currently selected sub-scenario.
You also have to specify an integrated scenario that will consist of the sub-scenarios you are about to save. Here again, you can either overwrite an existing integrated scenario or save to a new integrated scenario. Since we want to retain the Baseline integrated scenario for later, we have to specify another name. It doesn’t really matter which name you use right now, since you are just interested in saving the sub-scenarios. In the next section, you will combine the sub-scenarios you create now into integrated scenarios.
- Enter the name Temp for the integrated scenario in the Save project window.
- Click the Save button in order to save the project.
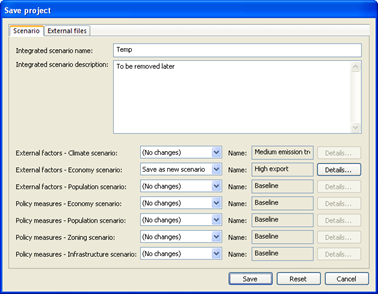
Save project window after all information has been entered
You have now created a new sub-scenario for External factors – Economy that assumes an increase in international exports. In the same way you can create another sub-scenario that assumes a decline in international exports, or you can define sub-scenarios for the other drivers available in WISE.
In the next section we will learn how to combine the sub-scenarios we created as part of integrated scenarios for which we can perform a simulation run and investigate the impacts of our assumed driver developments.
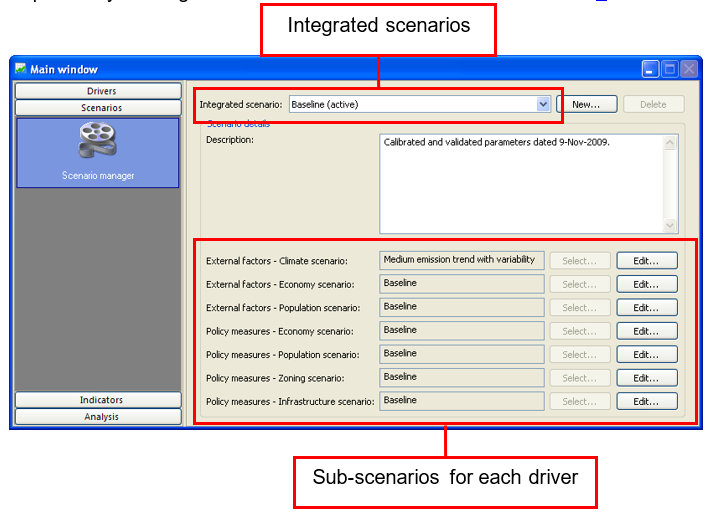
3.3.3.2 Managing integrated scenarios
If you have followed the steps in the previous section, you now have two integrated scenarios: Baseline, using the baseline sub-scenario for External factors – Economy and Temp, using the High export sub-scenario. You can verify this in the Scenario manager that is opened by clicking the Scenarios tab in the Main window – see 0.
Creating a new integrated scenario
If you want to investigate the impact of climate change, you can run a simulation using e.g. the high emission climate scenario and compare the results with the baseline integrated scenario that uses the medium emission climate scenario. In order to do this, we first have to create a new integrated scenario that uses the high emission sub-scenario for climate.
- Go to the Scenarios tab in the Main window.
- Click the New button to create a new integrated scenario.
- Select the High emission trend with variability sub-scenario for climate.
- Select the Baseline sub-scenario for the other drivers.
- Enter the name Climate change for the integrated scenario.
- Click the OK button.
To run a simulation with the newly created integrated scenario, you must first activate it.
- Select the integrated scenario Climate change from the list in the toolbar – see 0.
- Click the Run button on the toolbar to run the simulation.
- If you don’t want to wait for the simulation to finish, click the Stop button on the toolbar.
Removing an integrated scenario
Remember that when you created and saved a sub-scenario in the previous section, you also saved a new integrated scenario. Since you don’t need that one anymore, you can remove it.
- Make sure that in the toolbar, the active integrated scenario is set to Baseline.
- Go to the Scenarios tab in the Main window.
- Select the integrated scenario Temp.
- Click the Delete button.
- Click the Save button in the toolbar to save your project.
Note that it is not possible to remove an integrated scenario when it is selected as the active scenario. In that case, you first have to activate another integrated scenario in the toolbar. Changing an integrated scenario You can change an integrated scenario by selecting another sub-scenario for one of the drivers. E.g. in the integrated scenario Climate change we have selected the baseline sub-scenario for External factors – Economy, but we could change this to the High export sub-scenario that we have created earlier.
- Make sure that in the toolbar, the active integrated scenario is set to Baseline.
- Go to the Scenarios tab in the Main window.
- Select the integrated scenario Climate change.
- Click the Select button next to the External factors – Economy scenario.
- Select the sub-scenario High export.
- Click the OK button.
- Click the Save button in the toolbar to save your project.
Select external factors – economy scenario window opened from the Scenario manager in the Main window
Note that it is not possible to change an integrated scenario when it is selected as the active scenario. In that case, you first have to activate another integrated scenario in the toolbar.
3.4 Running the simulation
A more general description about running the simulation is available in the section Running the simulation. In this section you will learn how to load an integrated scenario and run the simulation and save its output results while running the simulation.
3.4.1 Saving output results
There are several ways in WISE that you can save output results. Before you run the simulation, you need to set up in which way and what you want to output.
3.4.1.1 Exporting individual maps
To export a map you need to have the map open in your active Map window. In this window you find the Save grid button in the Tools pane on the right low part of the window (see for example the Land use map window).
Clicking on the Save grid button allows you to export the map to any folder you like. There are several different file types that you can choose to export maps, from these the Arc ASCII format (.asc) and the IDRISI raster format (.rst) the most common formats. These file types can be used in the MAP COMPARISON KIT (MCK).
3.4.1.2 Creating log maps
Log maps can be created by clicking on the option Log maps…on the Options menu as described in the section Log maps. When turning on the log functionality, remember that more maps you select and more disk space you need to save them.
You can decide yourself how many maps you want to store for eventual analysis. You can open these maps in the MCK (part of the WISE package) or a common GIS packages, for further analysis after the simulation has run.
3.4.1.3 Creating animations
Animations are movies that show the spatial developments (e.g. land use, accessibility, …) over time. Animations can be created by clicking on the option Animate maps… on the Options menu as described in the section Animate maps. All selected maps which are categorised by model blocks will be saved in Animated GIF format which you can play in a web browser or picture viewer.
3.4.1.4 Writing model results to Excel
Model results can be written to Excel by clicking on the option Write to Excel on the Options menu. A Write to Excel settings window pop-ups that allows you to select what information you would like the WISE system to write to Excel. For a detailed explanation on how to write information to Excel, go to the section Write to Excel.
3.4.2 Running the simulation
Land use change has a spatial as well as a temporal aspect. The spatial aspect is visible in the form of a map; the temporal aspect is included in the dynamic computation of changes. You have learnt to create your integrated scenarios in last section. You will investigate what outcome the integrated scenarios will produce.
- Make sure you have opened your project file of interest in WISE on your screen.
- Activate your integrated scenario from the dropdown list next to Integrated scenario on the toolbar. For more information, see the section Active integrated scenario.
The selected integrated scenario is loaded into the system. When the Step, Run and Reset buttons on the toolbar become enabled, the system is ready to run. To run a simulation, you have the following basic options, which are also described in the section Toolbar. You can find these buttons on the toolbar on the top of your screen, but you can also access to them through the Simulation menu):
- When you press Step, WISE computes the change for one year.
- Run lets the simulation run until the final year or the next pause. The lenght of the simulation and thus the final year depends on the version of the WISE simulation files you use.
- Stop lets the simulation stop at the end of the year it is currently computing.
- Reset finally resets the simulation to the initial starting year.
Besides the basic functionality there are two advanced options to run a simulation: Update and Pauses. These options can be found through the Simulation menu. They are described in the section Simulation menu.
3.5 Visualising indicators
The basic output WISE produces are maps (land use map, climate maps, hydrology maps, water quality maps and threatened environment map) and numerical values. However, these maps and figures are not always easy to interpret at first instance. For that reason, WISE offers you the opportunity to compute indicators as well. An indicator in this context is a measure to make a particular phenomenon perceptible that is not –at least not immediately– detectable.
Indicators are organised in four groups in the user interface:
- Social indicators
- Economic indicators
- Environmental indicators
- Land use indicators
Some of these indicators describe a state or a condition (e.g. the maps under the Environmental indicators section, the age-cohort figure and the numerical values in the tables) and others show a change over time (the timeline graphs). The first set of indicators for the start year is already available when starting up the simulation; for the second set the simulation requires a step first; otherwise no change can be calculated.
You can visualise the social indicators, economic indicators, environmental indicators and land use indicator at any point in time (any year) during the simulation. To visualise an indicator, take the following steps:
- Go to the Indicators tab of the Main window.
- Select sections in the navigation pane on the left hand side of the Main window the type of indicator you are interested in: Social, Economic, Land use and Environmental.
To visualise the numerical values in the table or single values
- Go to the Social section of the Indicators tab.
- Click the Density tab.
- Select your residential land use of interest on the dropdown list next to Land use. The values of the density, the lower bound and the upper bound for each district and for the selected residential land use are displayed on the screen.
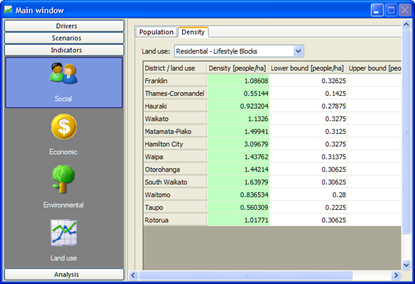
Particularly, if the density for the selected land use is between the lower bound and upper bound, the values are highlighted with green background. If the density for the selected land use is smaller than the lower bound or bigger than the upper bound, the values are highlighted with red background.
- Density smaller than lower bound indicates that the proportion of people living in the selected residential land use is too small.
- Density bigger than upper bound indicates that the proportion of people living in the selected residential land use is too big.
You need to adjust the proportion of people living in each residential land use category via the Policy measures section under the Drivers tab. For more information, see the section Policy measures.
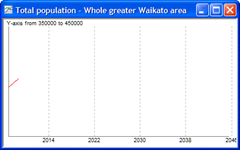
To visualise time line graphs
- Go to the indicator group of interest the Indicators tab.
- Select your district or sector of interest on the dropdown list.
- Click the graph icons behind the names of your variables of interest. The corresponding time line graph window opens where changes are displayed over time.
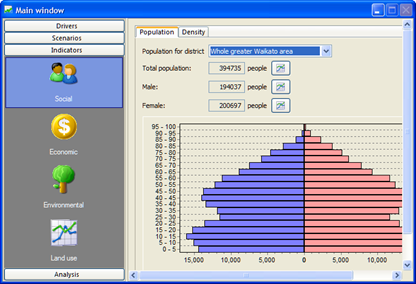
To visualise the chart and figure for the social indicators
- Go to the Social section of the Indicators tab.
- Click the Population tab to view the age cohort figure for the current simulation year.
To visualise detailed environmental indicator maps
- Go to the Environmental section of the Indicators tab.
- Click the Show map button next to the indicator of interest. The corresponding map is displayed in a map window.
All spatial indicators can be stored in log maps and as animations. All other indicator results can be written to Excel. For more information about how to writing information to Excel and how to create log maps and animations, see the section Saving results. How to compare indicators over time and between scenarios is described in the section Analysing results.
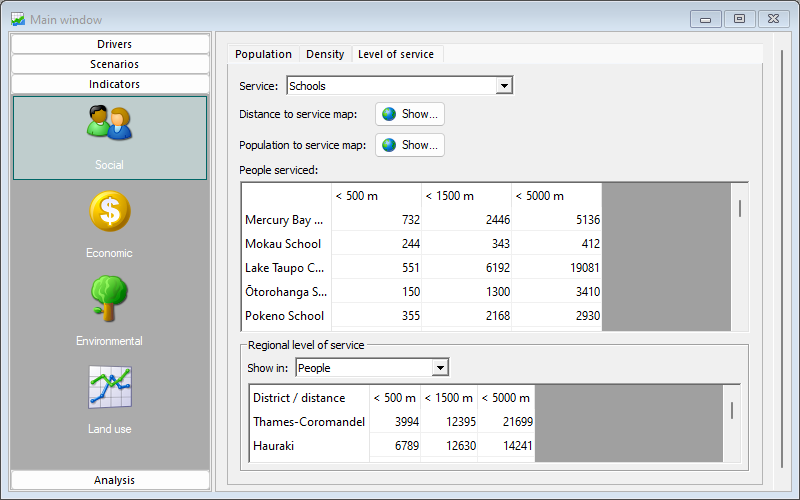
3.5.1 Level of service
The 'Level of service' tab on the 'Social' indicators shows service provisioning to people living in residential land use cells, i.e. the number of people living within certain distances of those services, as well as the number of people serviced by each service provider. 'Services' in this context are public services such as schooling, hospitals etc.
Users can enter their own maps that represent the location of service providers. Service maps need to be provided in the form of 'point' type shapefiles, with each point having an attribute 'name' which is used to label that service provider.
The 'Distance to service map' shows for each cell at what distance (in meters) the nearest service of the type selected at the top of the dialog is.
The 'Population to service map' shows the same values except only for cells with a residential land use.
'People serviced' shows the number of people in residential land use cells within certain radii. These radii are configured in the simulation file per service, and can only be changed by manually editing this simulation file.
'Regional level of service' shows per district how many people live within certain radii of a certain service. This can be shown in absolute numbers (select 'People' under 'Show in:') or as a percentage of the total population of that region (select 'Percentage of population').
3.5.2 Hazard and impact
Hazard and impact indicators are included under the 'Economic' indicator section, grouped under 'Value at risk'. Their inputs are 'hazard category' maps, which are categorical maps that represent a risk level per cell, which is then mapped to a value at stake for that risk level and the land use at that cell. Note that there is no concept of hazard severity. They represent risk at a single chosen incidence interval or occurrence likelihood. Hazard category maps need to follow the same rules as other categorical maps in WISE; the most pertinent consequence of this is that map values need to start at 0 and be consecutive integers.
'Hazard areas' shows the input maps.
'Hazard damages' is the input map multiplied with the damage for that cell and land use. In other words, it represents the value at risk at that location.
The table shows regional (district level) totals for each hazard, as well as (in the last columns and rows) totals per district and hazard, resp.
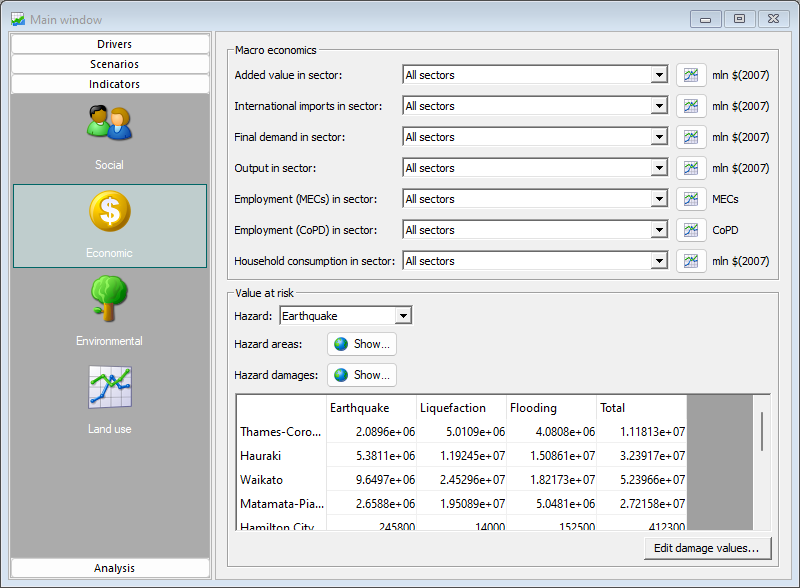
3.6 Analysing results
The final step of the impact assessment study is to analyse results within an integrated scenario (e.g. the temporal evolution of an integrated scenario) or to compare a set of integrated scenarios.
3.6.1 Analysing spatial results
In order to analyse spatial results (maps) more carefully it is often helpful to analyse them pixel by pixel or to compare only the land use type you are interested in.
You have run the simulation with different integrated scenarios and saved result maps using Log maps command on the Options menu. To investigate these maps you will use the Map Comparison Kit, abbreviated to MCK. This is a tool that contains a multitude of algorithms to compare maps on a pixel by pixel basis. For more information, we refer to the accompanying MCK user manual of the MCK software.
3.6.1.1 Short overview of the MCK
An overview of the MCK looks is depicted below.
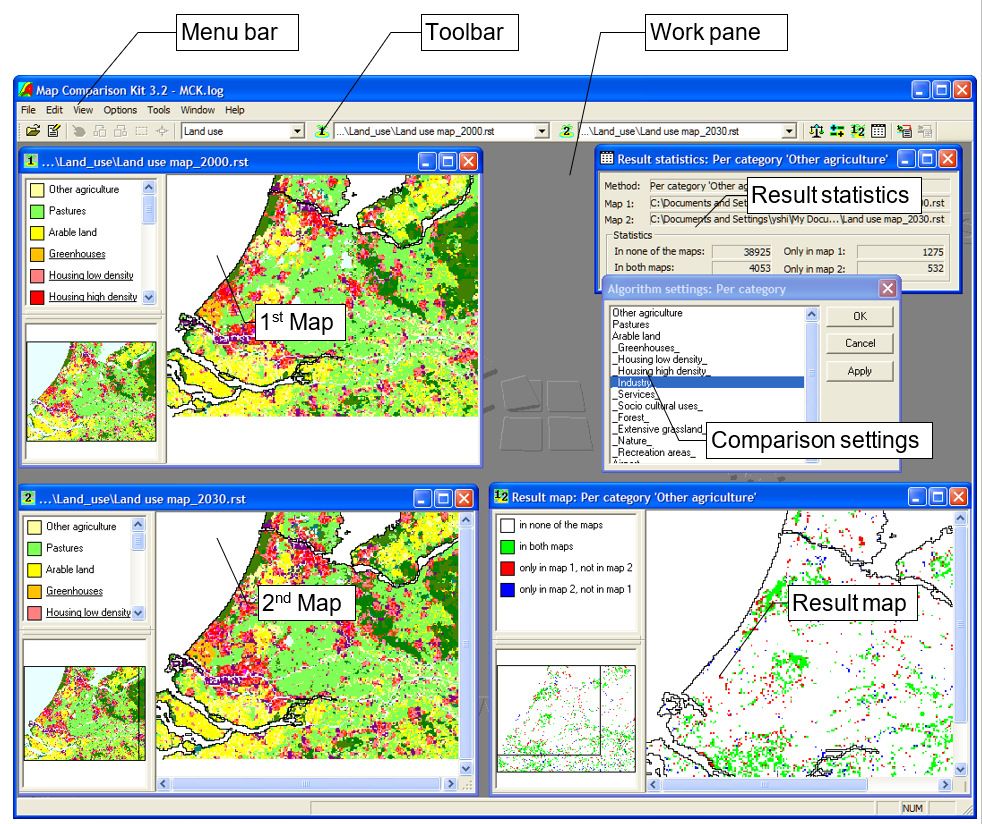
The Map Comparison Kit application window consists of the Menu bar, the Toolbar and the Work pane. You can simultaneously open different windows for maps and statistics. Furthermore, it is possible to keep the Comparison Settings dialog window opened while working with the tool:
-
The 1st Map window contains the first map to compare/analyse. To change the contents of toolbar the 1st Map window, choose another map from the dropdown list next to the 1-button on the. If the 1st Map window is not open yet, then you can do so by clicking the 1 button.
-
The 2nd Map window contains the second map to compare/analyse. To change the contents of the 2nd Map window, choose another map from the combo box next to the 2-button on the toolbar. If the 2nd Map window is not yet open, then you can do so by clicking the 2 button.
-
The Result map window contains the result map. This map shows the spatial result of the last performed map comparison. Depending on the selected comparison method the results are presented in a continuous scale or a nominal scale.
-
The Result statistics window contains the statistical results of the last performed map comparison.
-
The Comparison settings dialog window allows setting and viewing the settings belonging to the active comparison method.
3.6.1.2 Comparing different years of one scenario
First we will analyse how the maps of the Baseline integrated scenario changes over time:
- Go to the Analysis tab in the navigation pane on the left hand side of the Main window of WISE.
- Press the Open Map Comparison Kit button in the content pane on the right hand side of the window. The Open dialog window of the MCK opens.
- Click the Cancel button in the Open dialog window.
- Select the Open option on the File menu of the Map Comparison Kit. The Edit Log File dialog window of the MCK opens.
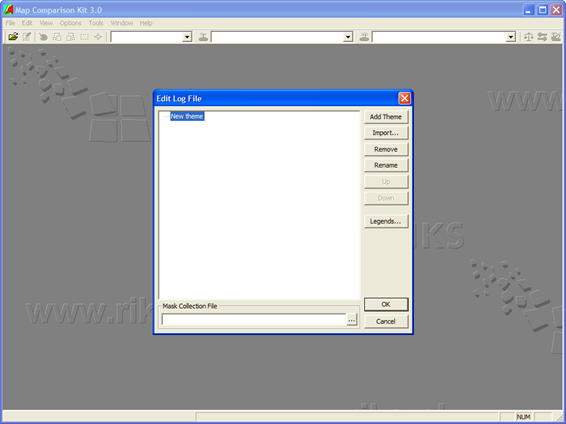
- Click the New theme item and give a name Land use for the new group of maps that you are going to import.
- Press the Import… button in the Edit Log File window. The Import… dialog window opens.
You will find the logged maps (*.rst) of the baseline scenario in the folder of \Documents\ Geonamica\WISE\Log by default or in the specific folder that you defined in the section Log maps.
- Select the *.rst in the Files of type box.
- Select the map that you want to compare. Repeat this step to import all the maps that you want to compare. The imported maps are displayed on the Land use list.
- Click the OK button in the Edit Log File dialog window. A Save as dialog window opens where you are required to name and save the project file of MCK in *.log format. Name the log file and press the OK button in the Save as window.
A *.log file is actually a file which contains a reference to one or several maps that you want to perform comparisons. When you open a log file in MCK, you can easily load all maps referred in the log file.
- Select the maps that you want to analyse from the dropdown list in the toolbar next to and next to , for instance, Land use map_2006.rst as Map 1 and Land use map_2030.rst as Map 2.
- Click the 1 button to open the land use map for 2006 in the 1st Map window and click the 2 button to open the land use map for 2030 in the 2nd Map window.
Note that the current legends in the left side of the map windows are still set by default. There are two ways to change the legend files of the land use maps that you imported in the MCK.
-
Edit the legend one by one in the Legend Editor by clicking on the Legend… option on the Edit menu on the menu bar. For more information, we refer the MCK user manual.
-
Copy the content of the land use legend file Documents\Geonamica\WISE\Legends\LandUse.txt that you used in WISE to the legend file \Legends\Land Use.txt that the Land use theme in MCK is used. This way you can have the same legend for the land use maps in MCK as the one used in WISE.
Now you are going to set comparison algorithm.
- Click the Algorithm button on the toolbar. The Comparison algorithm dialog window opens.
- Click the checkbox in front of Per category in the Comparison algorithm window. Press the OK button on the top-right of the window.
- Now to choose which land use you want to investigate, click the Parameters button on the toolbar. The Algorithm settings: Per category dialog window opens.
- Select Commercial land use and click the OK button in the Algorithm settings: Per category dialog window.
- Click the Compare button on the toolbar. Now the Result map: Per category Commercial opens where there are 4 options available: in none of the maps, in both maps, only in map 1 and not in map 2 and only in map 2 and not in map 1.
Besides the land use map, you can also analyse other categorical maps in the same way. To do this, import and select another type of categorical map from the dropdown list on the toolbar and repeat the steps above.
If you are interested in looking at the statistical information regarding the changes, you can go to the option Result statistic on the Options menu or press the Statistics button on the toolbar.
Numerical maps, like the accessibility maps, suitability maps etc that show numerical values, can be compared using measures that can be found under the Compare numerical maps in the Comparison Algorithm window.
Select the total potential maps for certain land use (or any other numerical map) in the dropdown list on the toolbar.
- Click the Algorithm button on the toolbar. The Comparison Algorithm dialog window opens.
- Select Comparison Algorithm → Compare numerical maps → Cell by cell → b-a.
- Investigate the changes in total potential for certain land use over time.
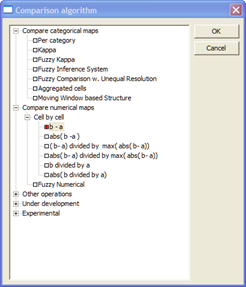
In this exercise you have investigated the actual land use change over one simulation. A more interesting investigation would be to compare the results of two different scenarios. This you will do next.
3.6.1.3 Comparing output maps of integrated scenarios
The simulation that you used until now, the Baseline integrated scenario, represents an extrapolation of observed historic developments combined with expected future developments. You can say it shows a ‘business as usual’ scenario that incorporates the processes as they are observed in the past and expected for the future. However, the full power of a spatial decision support system lies not in this baseline integrated scenario but in investigating different integrated scenarios and analysis of scenarios and effects of policy measures. Hence it helps you to answer “what if. . . .” type of questions.
In this exercise you will compare an alternative integrated scenario with the Baseline integrated scenario. For this we will again use the MCK. To incorporate the logged maps from the alternative integrated scenario,
- Go to the option Log file… on the Options menu. The Edit Log File dialog window opens.
- Press the Import… button on the right hand side of the Edit Log file window.
- Select the *.rst file type and select the logged maps of your integrated scenario of choice.
- Click the OK button in the Edit Log File window.
Instead of comparing the start and end map of the simulation within one integrated scenario you can investigate the difference between two integrated scenario results. We will again do this per category.
- In the MCK select the Baseline integrated scenario result map in 2030 as Map 1 and the alternative integrated scenario result map in 2030 as Map 2.
Now you can investigate the categorical maps in more detail.
- Click the Algorithm button on the toolbar. The Comparison algorithm dialog window opens.
- Click the checkbox in front of Per category in the Comparison algorithm window. Press the OK button on the top-right of the window.
- Click the Parameters button on the toolbar.
- Select your land use of interest in the Algorithm settings: Per category dialog window.
If you have already import the logged map of the suitability map for commercial,
- Select the suitability maps for commercial from the dropdown list in the Toolbar in the MCK.
- Investigate the changes in suitability map for commercial between integrated scenarios by selecting Comparison Algorithm – Compare numerical maps – Cell by cell – b-a.
Now you can investigate the difference between the result maps of two integrated scenarios.
3.6.2 Summary
In the last section you have analysed different results maps of the WISE system. You have compared results from different years within an integrated scenario as well as results of a certain year between integrated scenarios. For this you have used the MCK functionality to compare categorical maps on a cell by cell basis, to compare numerical maps on a cell by cell basis and to show integrated statistics.